What Top-Performing C-Stores Are Doing Differently Heading Into Q4 2026
A busy store does not always mean a profitable store.
Prepared food may sell well, but waste can reduce the margin. A loyalty app may gain signups, but a difficult experience can stop customers from using it. Meanwhile, some large chains are opening stores as others remove locations that no longer meet their goals.
These changes are shaping the c-store industry trends of 2026.
Heading into Q4, top-performing c-stores are focusing on five areas. They are improving prepared-food offers, giving customers clear value, making digital tools easier to use, strengthening daily store operations, and expanding only where the numbers support it.
Independent operators may not have the scale of a national chain. However, every operator can track what customers buy, when demand changes, where waste occurs, and which products earn the strongest margin.
This article draws on the research behind the Modisoft Q3 2026 Industry Trends & Market Insights Report. The report analyzes data and findings from 48 government, industry, research, and business sources, including NACS, the U.S. Bureau of Labor Statistics, the U.S. Energy Information Administration, Datassential, and the U.S. Census Bureau.
Trend #1: Prepared Food Is Taking a Larger Share of Inside Sales
Prepared food is giving more customers a reason to walk into a convenience store.
The latest NACS State of the Industry data shows the size of this opportunity. Foodservice now accounts for 28.5% of c-store in-store sales and 38.9% of in-store gross profit dollars. Prepared food, including pizza, chicken, burgers, sandwiches, wraps, and salads, makes up 73.9% of foodservice sales.
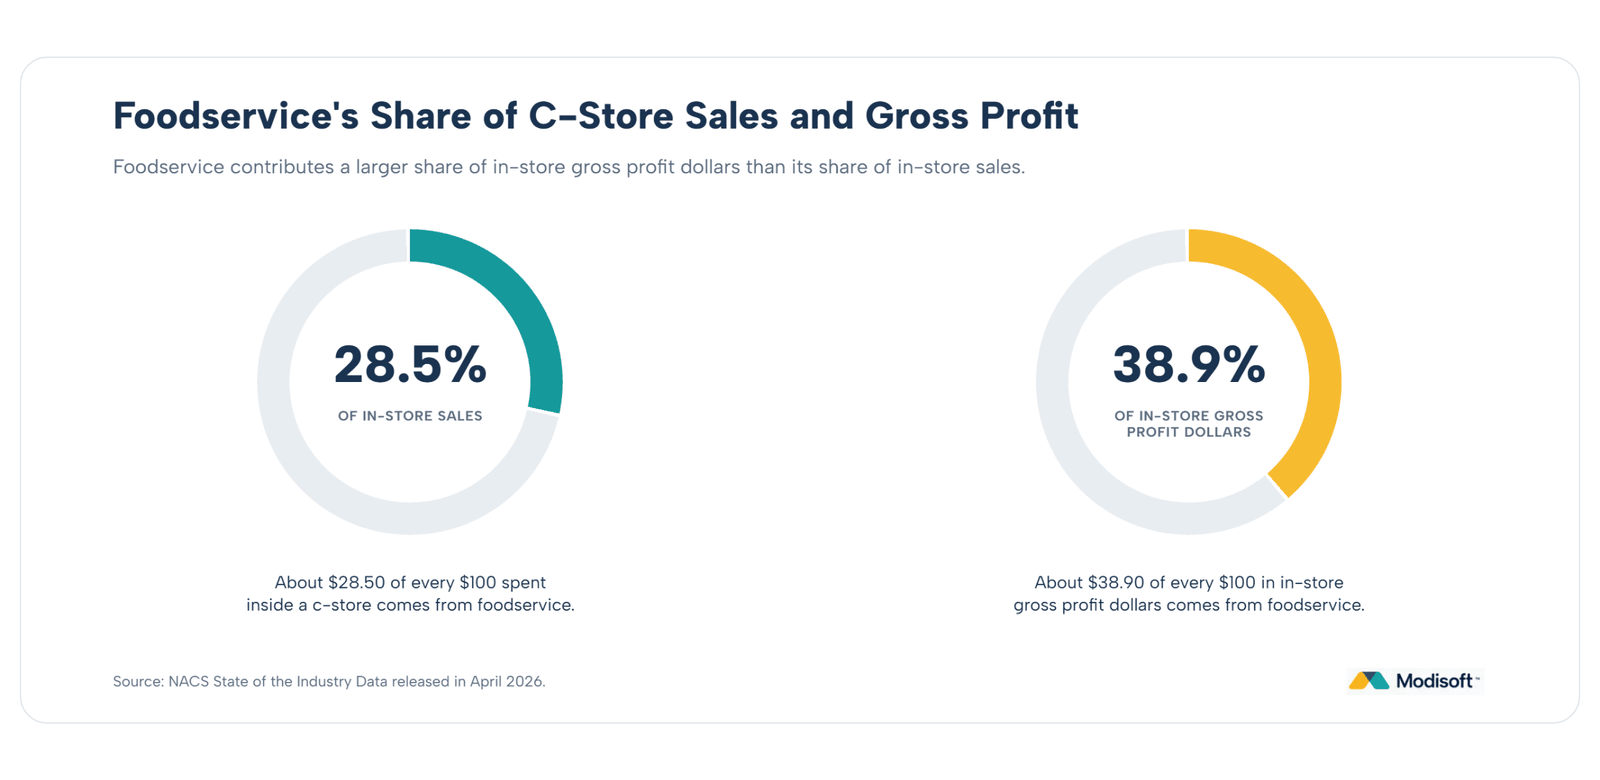
These figures reflect full-year 2025 performance. However, NACS released them in April 2026 as its latest complete annual benchmark. The findings include data from convenience retailers representing more than 35,000 stores.
More recent operator research shows that the gains continued into 2026.
Datassential found that 60% of surveyed c-store operators reported higher food and beverage sales over the previous year. Customer views are also changing. Forty percent said c-store food variety is getting better, while 75% were satisfied with the variety of prepared food available.
These findings, also examined in the Modisoft Q3 2026 Industry Trends & Market Insights Report, point to a clear change. Prepared food is no longer a small add-on near the register. For many stores, it is becoming an important source of inside sales and profit.
However, adding more food does not guarantee better results.
Fresh items have short selling windows. Preparing too little can leave customers facing empty displays. Preparing too much can turn a strong sales day into a costly waste problem.
The stores handling this well are paying attention to sales, waste, availability, and margin at the same time.
What Top C-Stores Are Doing In 2026
- Tracking prepared-food sales by item and time of day
- Keeping popular products available during busy periods
- Comparing food sales with waste and gross margin
- Removing slow products before adding more menu choices
These steps help answer four basic questions:
- What are customers buying?
- When are they buying it?
- How much prepared food is being discarded?
- Which products earn enough to remain on the menu?
Total sales cannot answer every question.
For example, an item may sell well but still produce a weak return because of ingredient costs, preparation time, or repeated waste. Another product may sell fewer units but provide a healthier margin.
That is why operators need to review the full picture.
How Casey’s Is Growing Prepared-Food Sales
Casey’s shows how a clear prepared-food offer can increase store traffic and inside sales.
For the quarter ended July 31, 2026, Casey’s reported a 4.8% increase in prepared-food and dispensed-beverage same-store sales. The category produced a 59.3% margin, compared with a 42.2% margin across total inside sales.
Most of the category’s growth came from higher customer traffic, led by whole-pizza sales. In other words, the increase did not come mainly from higher prices. More customers were buying Casey’s prepared food.
That does not mean every c-store should copy Casey’s menu. Instead, the results point to three parts of a strong food offer:
- Customers understand what the store is known for.
- The food feels worth the price.
- The category earns enough after product costs.
Availability also matters. A popular product cannot increase sales if customers regularly find it unavailable. For independent operators, the lesson is simple: focus on a smaller group of products that customers want, then track traffic, sales, margin, and waste around those products.
How Store Data Improves Food Planning
As a food program grows, tracking every product by hand becomes difficult.
Operators need to know what sold, when demand increased, what was discarded, and how much margin remained. When those details sit in separate spreadsheets or paper logs, finding a clear pattern takes longer. Connected store technology can bring that information into one place:
- Item-level reporting shows which products sell and when.
- Daypart reporting shows how sales change throughout the day.
- Waste tracking identifies products that are prepared too often.
- Margin reporting shows which products are worth keeping.
Demand forecasting adds another layer. It uses past sales patterns to estimate how much demand a store may see during a future period.
For example, a store can compare breakfast sandwich sales across weekday mornings, weekends, holidays, and local events. The team can then plan preparation around likely demand instead of making the same quantity every day.
Do You Know What Your Customers May Buy Next?
Changing demand can lead to empty shelves or excess food. Modisoft Demand Forecasting uses past sales patterns to help operators plan inventory and food preparation more accurately.
Still, forecasting is only as reliable as the information behind it. Missing sales records, incorrect inventory counts, and incomplete waste logs can lead to poor estimates.
Independent operators do not need to begin with a complex AI system. Accurate POS sales history, hourly item reports, and a daily waste log can provide a useful starting point.
How to Improve Your Foodservice Program for Q4 and Beyond
Review the past eight to twelve weeks of foodservice results before holiday travel and winter traffic change customer demand.
Use those results to focus on three areas: identify the product customers return for, confirm that the offer feels worth the price, and protect the margin after costs and waste.
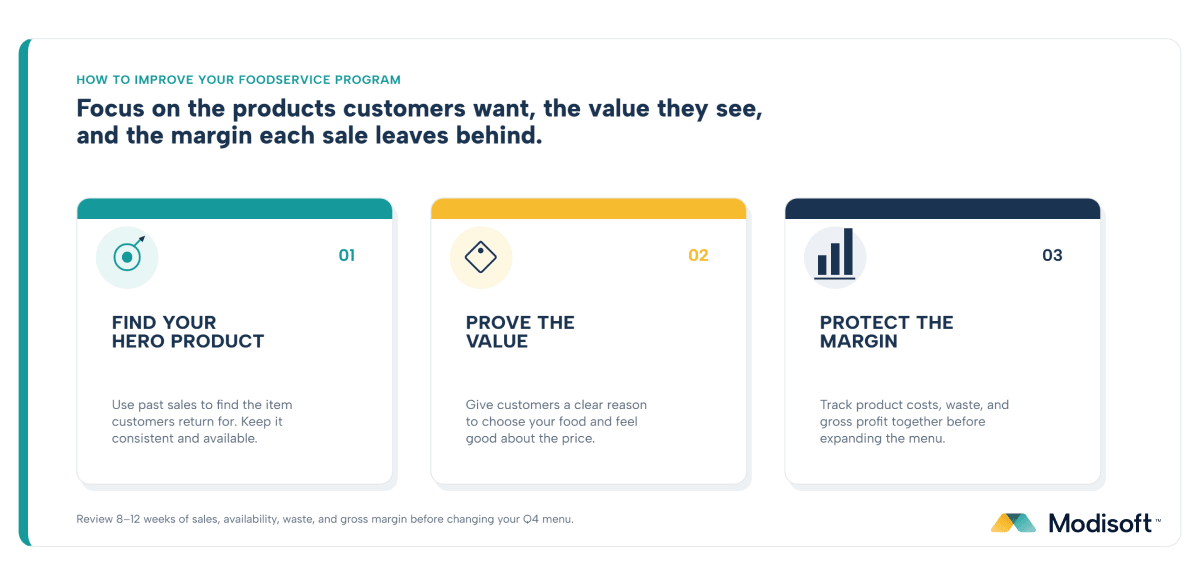
Next, review your foodservice program by asking four questions:
- Which products sell best during each part of the day?
- Which products sell out during busy periods?
- Which prepared foods are discarded most often?
- Which products produce the strongest gross profit?
Compare the answers with product availability and waste. Keep popular items ready during busy periods. Then, reduce preparation during slower times. Also, review products that repeatedly create waste without producing enough sales or gross profit.
Continue this review after Q4. Customer demand will change with the season, local events, pricing, and new buying habits. Regular sales and waste reviews can help the store adjust before small problems become costly.
A focused menu built around a recognizable hero product may perform better than a large menu that is difficult to manage. Start with what customers already buy, improve the offer, and expand only when the results support it.
Trend #2: Clear Value Is Bringing Price-Conscious Customers Back
Customers are noticing better food at convenience stores. However, they are also watching prices more closely.
The Modisoft Q3 2026 Industry Trends & Market Insights Report found that value now means more than offering the lowest price. Customers also consider food quality, freshness, portion size, convenience, and speed before deciding where to spend.
The report’s analysis of recent c-store consumer research shows this tension clearly:
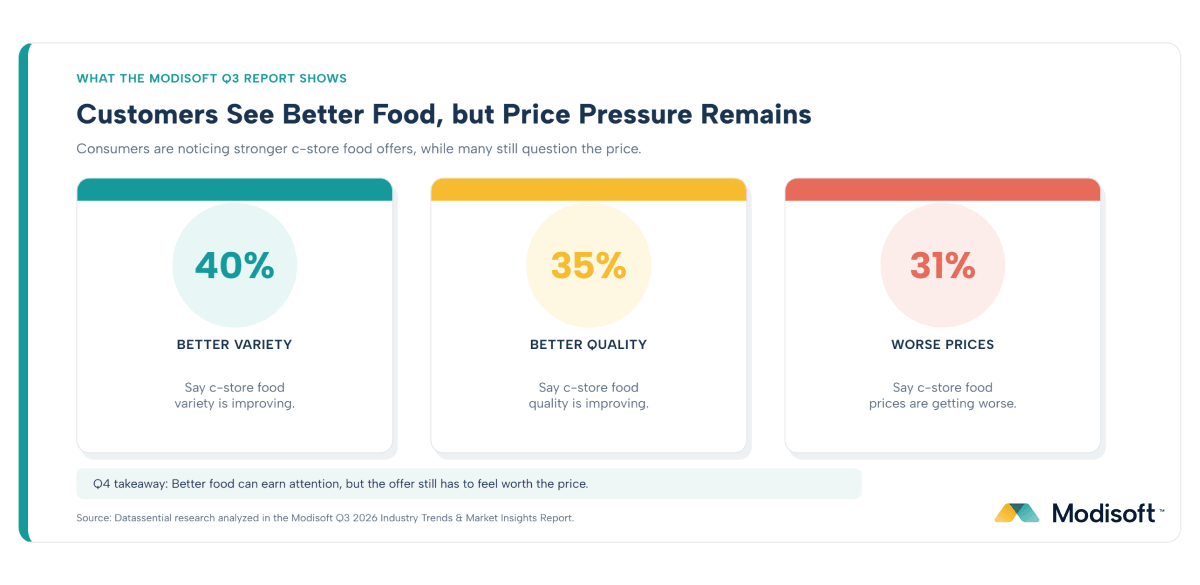
- 40% of consumers said c-store food variety was improving.
- 35% noticed better food quality.
- 33% saw an improvement in freshness.
- Yet 31% said food prices were getting worse.
This gap matters heading into Q4.
Better food can bring customers into the store. Still, the offer must feel worth the price. Higher fuel and living costs made purchases more deliberate during Q3. Optional purchases often needed a clearer reason, such as an immediate need, a useful promotion, or an easy-to-understand price.
The goal is not to become the cheapest store in the market. It is to offer the right mix of quality, convenience, portion size, and price.
What Does Value Mean in Convenience Retail?
For a c-store customer, value is the total experience received for the price paid.
That experience may include:
- Food quality and freshness
- A useful portion size
- Fast ordering and checkout
- A clear total price
For example, a breakfast sandwich may feel expensive when sold alone. However, a sandwich, coffee, and hash brown at one clear price can feel like a complete meal.
The discount is only one part of the offer. The bundle makes the value easier to recognize.
What the Modisoft Q3 Report Shows About C-Store Food Value
The Modisoft Q3 2026 Industry Trends & Market Insights Report reveals that customers are noticing better c-store food, but improved quality alone may not win the purchase.
As shoppers become more selective, operators must make value clear through the right balance of quality, portion size, convenience, and price.
What Top Stores Are Doing
- Building bundles around products customers already buy
- Using clear price points that are easy to compare
- Keeping loyalty savings simple to find and redeem
- Checking whether offers improve sales, visits, and gross margin
The strongest value offers reduce the amount of thinking required from the customer. The products are familiar. The total price is clear. The customer knows what is included before reaching the register.
How Circle K Is Making Value Easy to Understand
Circle K offers a clear example of how simple bundles can support foodservice performance.
During the quarter ended February 1, 2026, Circle K sold 13.3 million meal-deal bundles. More than half were sold at the $3 price point. Roller-grill products and breakfast sandwiches led the product mix.
The offers use clear price levels:
- A $3 meal with a hot dog or taquito, chips, and a fountain drink
- A $4 breakfast meal with a sandwich, hash brown, and beverage
- A $5 lunch meal with a sandwich, chips, and beverage
Customers do not need to find several coupons or calculate separate discounts. Each offer shows what is included and what the complete meal costs.
Alimentation Couche-Tard, which owns Circle K, reported a 2.8% increase in U.S. same-store merchandise revenue during the quarter. Management said customers were responding to the value and ease of offers such as Meal Deals.
Foodservice also helped the company record its strongest U.S. same-store merchandise performance in more than two years.
These results do not mean every bundle will produce the same outcome. The useful lesson is how the offer is built:
- Start with familiar products.
- Place the products into a complete meal.
- Use one clear price.
- Make the offer easy to find and understand.
More C-Stores Are Making Meal Value Clear
Circle K is not the only major chain using this approach.
In September 2026, 7-Eleven introduced new value menus heading into Q4 at participating Laredo Taco Company, Raise the Roost, and Speedy Cafe locations.
The offers included:
- Two breakfast tacos and a small coffee for $5
- Two lunch tacos and a large fountain drink for $7
- Selected breakfast and lunch products below $4
- Wraps and other items below $3
These offers were built around common breakfast, lunch, and dinner needs.
However, 7-Eleven had not published results showing how the value menus affected sales or traffic at the time of this research. But it shows a clear pattern. Large chains are making value easier to see by grouping familiar products under one simple price.
How Store Data Helps Build Better Offers
A strong bundle should begin with what customers already buy. It should not be used only to clear slow products. Store data can reveal which items customers often purchase together and which products are strong enough to anchor an offer.
Four types of reporting can help:
- Basket analysis shows which products appear in the same transaction.
- Item-level reporting identifies products with steady demand.
- Loyalty data shows how members respond to different offers.
- Promotion reporting measures sales and customer activity during a campaign.
For example, basket data may show that customers often buy a breakfast sandwich with coffee. The operator could test one clear price for both products rather than discounting unrelated items.
Once the offer is active, the operator should track:
- Transactions
- Units sold
- Average basket size
- Gross margin
- Repeat visits
An offer may increase sales but reduce gross margin too far. Another may bring customers back without changing the average basket. Reviewing several measures helps operators understand the full result.
Are Your Offers Bringing Customers Back?
Modisoft loyalty and reporting tools help operators create targeted offers, review customer buying patterns, and track the response to each campaign.
Modisoft’s loyalty tools support customized rewards, special offers, customer targeting, and campaign reporting. The platform also integrates with the POS to provide current purchasing data.
How to Build Q4 Offers Customers Understand
Begin by reviewing which products customers already buy together. A familiar combination will usually be easier to explain than a promotion built around unrelated products.
Then, ask four questions:
- Which products often appear in the same transaction?
- Which total prices are easy for customers to understand?
- Does the offer increase transactions or only reduce the price?
- Do loyalty members return after using the offer?
Keep the promotion simple. Show the full price and everything included. Use the same message on the menu, shelf, loyalty app, and register.
Next, review the results while the offer is still active. If sales rise but gross margin falls too far, adjust the products or price. If customers show little interest, test another combination based on recent basket data.
Also, avoid sending the same promotion to every shopper. A morning customer may respond to coffee and breakfast. An evening customer may prefer a snack, beverage, or complete meal offer.
A strong Q4 offer should be easy to understand, built around products customers already want, and measured after the campaign ends.
The aim is not to offer the largest discount. It is to give customers a clear reason to choose the store and return.
Trend #3: Top C-Stores Are Looking Beyond Sales to Measure Profit
Higher sales can make a store look successful. However, sales do not show how much money remains after product costs, labor, waste, shrink, card fees, and discounts.
The Modisoft Q3 2026 Industry Trends & Market Insights Report found that this difference became more important during Q3. Transactions remained under pressure, operating costs increased, and customers became more selective. As a result, top operators placed less emphasis on sales growth alone and paid closer attention to what each product, offer, and store contributed to profit.
The latest NACS in-store performance data shows why this change matters. The average inside basket value increased by $0.24, but inside basket profitability fell by $0.08. Higher product and operating costs absorbed the added basket value. Inside transactions also declined 1.6% per store per month.
In simple terms, customers spent more per inside transaction, but stores kept less profit from the average basket.
A Bigger Basket Did Not Mean More Profit
The Modisoft Q3 2026 industry report reveals an important gap between sales value and basket profitability. A larger transaction may look positive at first, but rising costs can reduce what the store keeps after the sale.
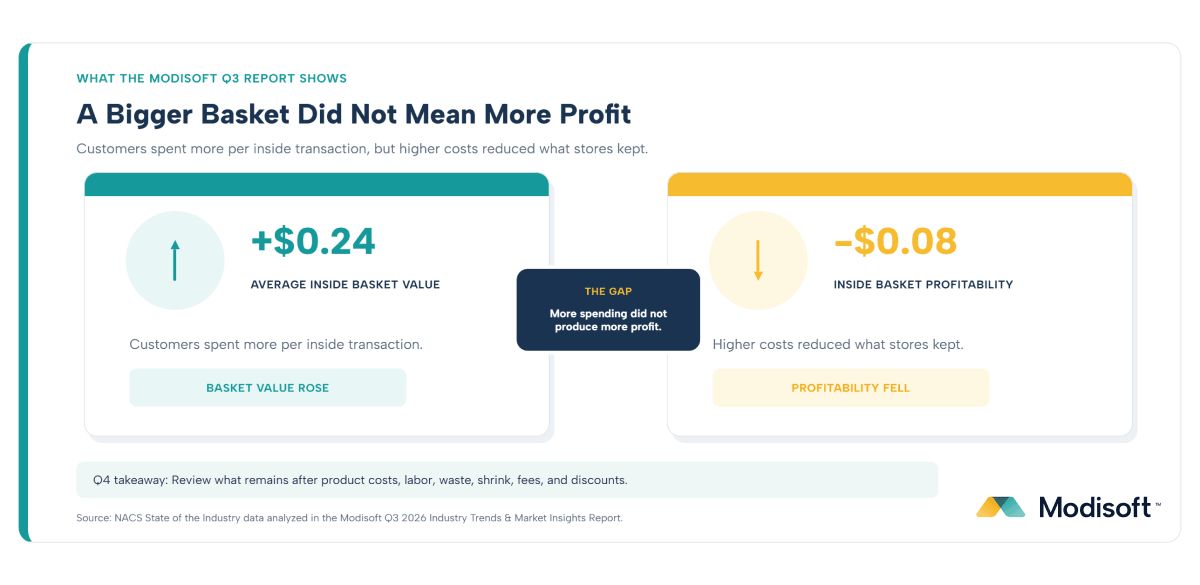
The gap does not mean every basket became less profitable. It reflects the industry average in the latest complete benchmark. Still, the finding shows why c-store operators should not use basket size as the only sign of stronger performance.
Rising Store Costs Add More Pressure
Operating costs place another limit on profit.
An August 2026 NACS analysis found that direct store operating expenses continued to grow faster than pretax profit. Wages and benefits rose 4.2%, workers’ compensation increased 9.8%, and health insurance and other benefits grew 10.5%.
Meanwhile, inside transactions declined 1.7%, while total transactions fell 3% in the latest complete benchmark. NACS also reported that customer behavior at the pump remained different during the first six months of 2026. Even as fuel prices increased, customers were not returning more often at the rate operators might normally expect.
That puts more pressure on each store visit.
Operators need to know whether a larger basket, meal deal, loyalty offer, or seasonal promotion leaves enough gross profit after its related costs.
What Top Stores Are Doing
- Tracking gross profit alongside sales
- Comparing labor, waste, and shrink with category results
- Reviewing performance by store, product, and time of day
- Acting on costly patterns before they become larger problems
These actions give operators a more complete picture.
For example, a promotion may increase unit sales but reduce gross profit too far. A food item may sell well but require too much labor or create repeat waste. A store may report higher revenue while card fees, shrink, and employee costs rise even faster.
The sales number is only the starting point. Operators still need to understand what remains.
How Murphy USA Is Pairing Growth with Cost Control
Murphy USA provides a current example of how a large operator separates sales activity from contribution, margin, and operating costs.
For the quarter ended June 30, 2026, Murphy USA reported net income of $209.1 million, compared with $145.6 million during the same quarter one year earlier. Merchandise contribution dollars increased 4% to $227.4 million, while the average merchandise unit margin reached 20.1%, up slightly from 20% the previous year.
The company also reported:
- A 3.9% increase in total retail fuel gallons
- A 0.5% increase in same-store fuel volume
- A total fuel contribution of 40.6 cents per gallon, up from 32 cents
- Adjusted EBITDA of $377.3 million, compared with $286 million one year earlier
Management linked the stronger quarter to fuel results, merchandise contribution growth, and continued expense discipline.
However, Murphy USA still faced higher expenses.
Store operating expenses reached $308.7 million. Higher payment fees caused about two-thirds of the increase, while employee-related costs connected with new-store growth also added pressure.
That is what makes the example useful.
Murphy USA did not measure success through revenue or volume alone. Its public results separated merchandise contribution, unit margin, fuel contribution, operating expenses, net income, and EBITDA.
Independent operators may not use the same reporting structure. However, the principle still applies: higher sales matter only when the store understands the costs behind them.
How Connected Store Data Reveals Where Profit Is Lost
Finding the cause of weaker profit becomes difficult when sales, inventory, labor, and financial data sit in separate systems.
Connected reporting can help operators compare several parts of the business in one place:
- Sales reports show what sold and when.
- Margin reports show which items contribute more gross profit.
- Inventory reports reveal overstock, shortages, and slow movement.
- Waste and shrink reports show where products or cash may be lost.
- Employee reports help compare staffing with store activity.
- Multi-location reports show why one store performs differently from another.
The goal is to connect the numbers so operators can see what caused the result.
For example, a store may find that evening sales increased after launching a meal deal. Yet the same period may also show higher food waste and more labor hours. Reviewing those results together helps the operator decide whether to change the price, product mix, preparation plan, or staffing level.
Industry research also shows that operators are interested in using data for this purpose. In a survey of more than 70 convenience retailers, using data to reduce waste or shrink was the leading cost-saving plan. The approach was selected by 58% of retailers with 10 or fewer stores and 72% of larger retailers.
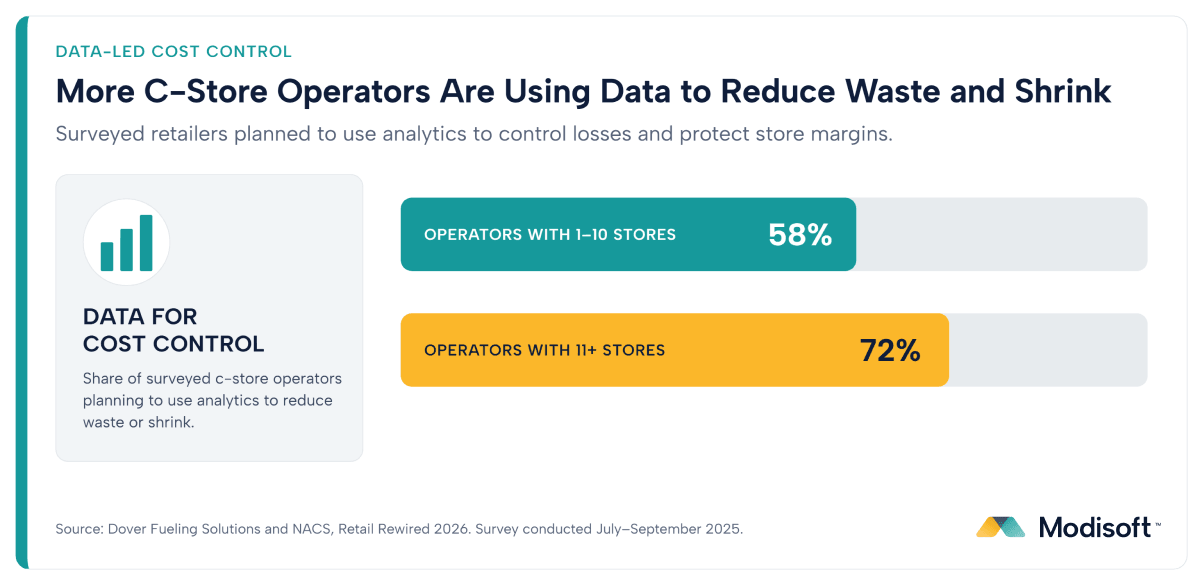
The difference suggests that data becomes even more important as an operator adds locations. Still, connected reporting is not only useful for large chains. A single-store operator can use the same approach to identify excess inventory, repeated waste, unusual discounts, and staffing patterns that reduce profit.
Can You See Where Store Profit Is Being Lost?
Modisoft Insights brings sales, inventory, financial, staffing, and store-performance data into one view. This helps operators identify costly patterns and respond sooner.
How to Protect Profit per Visit in Q4 and Beyond
Review the past eight to twelve weeks of store performance before making Q4 decisions. Do not look at revenue alone. Compare sales with the costs required to produce them.
Start with four questions:
- Which categories produce the strongest gross profit?
- Where are labor costs rising faster than sales?
- Which products create the most waste or shrink?
- Which promotions increase sales but leave too little profit?
Next, review the results by product, time of day, and location.
A promotion may perform well during the morning but reduce margin when offered all day. One location may need a different product mix or staffing plan than another. A popular product may also need a price, portion, or preparation change when its costs rise.
Payment fees and discounts deserve attention too. These costs may appear small on one transaction, but they can add up across thousands of purchases.
Finally, define what a profitable visit looks like for your store. Consider the gross profit earned, promotion cost, labor required, and any waste or shrink linked to the sale.
Higher sales still matter. However, top-performing c-stores also measure what remains after the sale.
What These Trends Mean for Independent C-Store Operators
Large chains may have more stores, larger teams, and bigger technology budgets. Still, independent operators can follow the same three principles behind stronger performance.
- Build around products customers already want. Use sales, margin, availability, and waste data to identify the items worth keeping and promoting.
- Make value easy to understand. Clear prices, useful bundles, and relevant offers give customers a stronger reason to buy.
- Measure what remains after the sale. Compare revenue with product costs, labor, waste, shrink, payment fees, and discounts.
The goal is not to copy another retailer’s menu, pricing, or promotions. Each store serves a different market. Instead, use your own store data to find what customers value, where profit is being lost, and which changes produce a measurable result.
See How C-Store Operators Are Putting Better Data to Work
The examples in this article show what several large chains are doing across the industry. However, connected reporting and smarter store management are not limited to national retailers.
Convenience stores of different sizes use Modisoft to monitor sales, manage inventory, reduce manual work, review margins, and keep a closer eye on performance across one or more locations.
Hear directly from Modisoft customers and see how c-store operators are applying these tools in their own businesses.
Prepare Your C-Store for What Comes Next
The trends shaping Q4 will not affect every store in the same way. Use the Modisoft Q3 2026 Industry Trends & Market Insights Report to compare wider industry changes with what you are seeing across your customers, products, costs, and locations.
Inside the report, explore the customer behavior shifts, category changes, cost pressures, and technology priorities that could shape c-store performance through Q4 and into 2027.
Download the Modisoft Q3 2026 Industry Trends & Market Insights Report
Frequently Asked Questions
What are the main c-store industry trends in 2026?
The main c-store industry trends in 2026 are the growth of prepared food, greater demand for clear customer value, and a stronger focus on profit rather than sales alone. Leading operators are using store data to track foodservice performance, build simpler offers, reduce waste, and understand what remains after product and operating costs.
Why is foodservice important for c-store profitability?
Foodservice accounts for 28.5% of c-store in-store sales and 38.9% of in-store gross profit dollars in the latest complete NACS industry benchmark. Prepared food represents 73.9% of total foodservice sales. However, operators must manage labor, ingredient costs, product availability, and waste to protect the category’s profit potential.
How can c-stores offer better value without relying on large discounts?
C-stores can create value by combining products customers already buy, using one clear price, and making the offer easy to understand. Operators should measure transactions, units sold, basket size, gross margin, and repeat visits to see whether an offer improves performance rather than only lowering the price.
Why should c-store operators look beyond sales revenue?
Higher sales do not always leave more profit behind. The Modisoft Q3 2026 Industry Trends & Market Insights Report highlights an important gap between spending and profitability. Based on NACS data, average inside basket value increased by $0.24, while inside basket profitability fell by $0.08 as product and operating costs rose.
How can store data help improve c-store profitability?
Connected store data helps operators compare sales, inventory, gross margin, labor, waste, shrink, and promotion results. This can reveal whether a popular product, meal deal, or campaign produces enough profit after its related costs. A Dover Fueling Solutions and NACS survey found that 58% of operators with 10 or fewer stores and 72% of larger operators planned to use analytics to reduce waste or shrink.
What should c-store operators review before Q4?
Before Q4, operators should review the past eight to twelve weeks of sales, gross profit, product availability, labor, waste, shrink, payment fees, and promotion costs. Results should also be compared by product, daypart, and location because customer demand and operating costs can vary across stores and times of day.